
-
 1 × $1,700.00
 -
 1 × $472.00
 -
 1 × $484.00
 -
 1 × $751.00
 -
 1 × $489.00
 -
 1 × $1,663.00
 -
 1 × $3,398.00
 -
 1 × $2,804.00
 -
 1 × $2,191.00
 -
 1 × $862.00
 -
 1 × $2,426.00
 -
 1 × $2,489.00
 -
-
 1 × $987.00
 -
 1 × $3,566.00
 -
 1 × $7,875.00
 -
 1 × $5,981.00
 -

-
 1 × $1,343.00
 -
 1 × $3,020.00
 -
-
 1 × $2,804.00
 -
 1 × $1,120.00
 -
 1 × $1,442.00
 -
 1 × $2,100.00
 -
 1 × $1,044.00
 -
 1 × $8,669.00
 -
 1 × $3,614.00
 -
 1 × $445.00
 -
 1 × $539.00


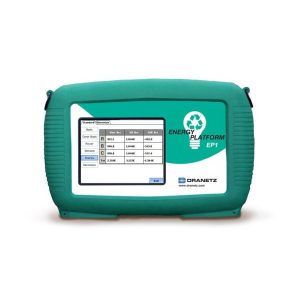
Dranetz ES2305AE

Roll over image to zoom in
$667.00
- Aggregated Energy Expense – usage and cost for all DataNodes® or monitoring instruments for a given time period
- Energy Expense – energy use for a particular DataNode for a specific time period compared to rate structure
- Energy Usage Comparison – energy use for a specific monitoring location for various time periods against a specified reference period
- Operating environment Installed in any InfoNode or Encore® Series Software
- Input data Accepts energy usage and demand data from any DataNode®. User must input rate structures and peak/off-peak consumption and demand parameters
- Output information On-peak energy consumption in $kWHr, $/kW, and $/kVARHr Partial-peak energy consumption in $kWHr, $/kW, and $/kVARHr Off-peak energy consumption $/kWHr, $/kW, and $/kVARHr
- Applications Creates reports showing total energy usage, energy usage compared against total, and energy usage for specified time intervals
- Algorithms Algorithms for usage comparison with rate, time, peak, penalty, and tax
Returns Policy
We accept returns within 30 days of delivery. To qualify, items must be unused, in their original condition, and returned with all original packaging and accessories.
Once we receive and inspect the returned item, we will process your refund within 7 business days. Refunds will be issued to the original payment method.
Please note: Shipping costs are non-refundable unless the return is due to a defective or incorrect item.


Reviews
There are no reviews yet.